
The U.S. housing market in 2026 is not one single story. It never really was. A “two-speed” market has emerged, with high-cost coastal and Sun Belt regions undergoing price corrections, while the Midwest and Northeast are proving remarkably resilient due to their relative affordability and stable employment bases. That split matters enormously if you’re deciding where to buy, sell, or invest.
Nationally, the picture looks deceptively calm. Housing prices nationwide edged up just 1.1% in the 12 months ended in February 2026, the slowest rate of appreciation since the American Enterprise Institute started collecting those numbers. Beneath that quiet surface, certain cities are experiencing something far more serious. The most vulnerable markets are those with elevated recent gains, weaker affordability, and rising inventory. Seven of them stand out as particularly worth avoiding right now.
1. Cape Coral, Florida: The Market Wall Street Called the Worst in America
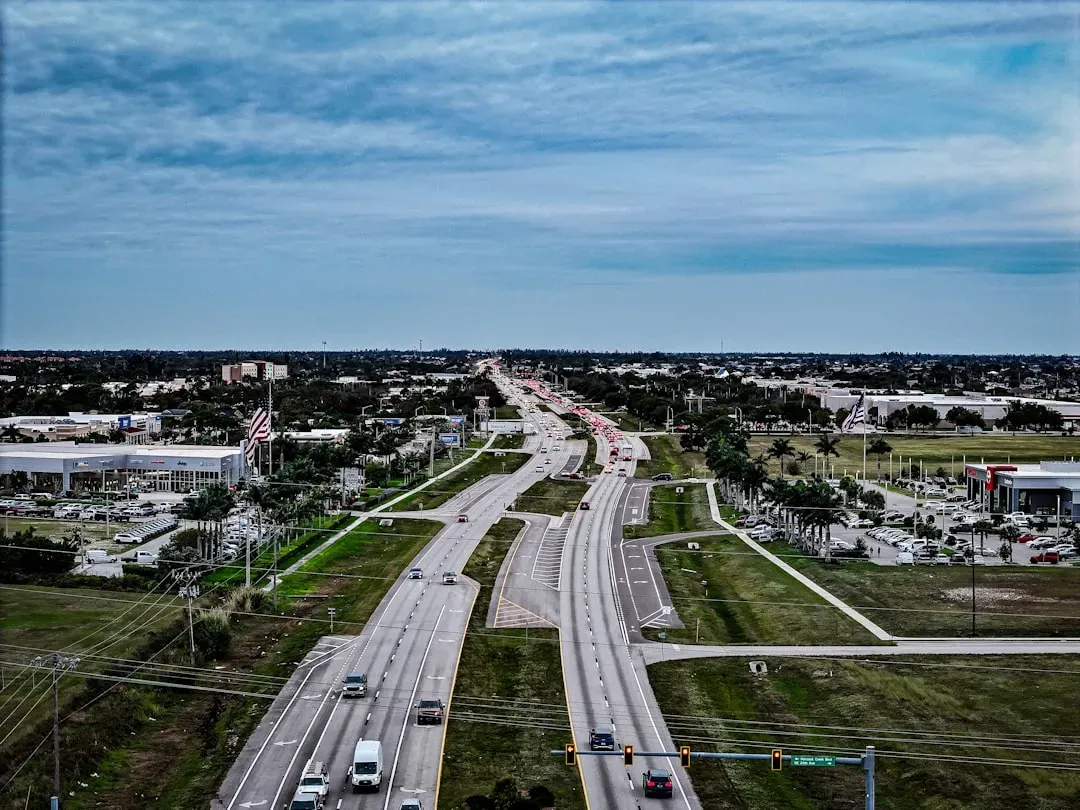
Cape Coral-Fort Myers is expected to see prices fall around 10% in 2026, and the Wall Street Journal recently dubbed Cape Coral the “worst housing market in America,” with almost 8% of owners owing more on their mortgages than their homes are worth. That negative equity situation is particularly alarming because it traps homeowners and can accelerate a downward spiral if sellers flood the market.
The typical single-family home in Cape Coral sold for nearly 7% less in August 2025 compared to the previous year, and compared to the pandemic boom of August 2022, the median home sales price had already dropped by over 13%. Being on the Gulf Coast makes Cape Coral especially vulnerable to hurricanes and flooding, which leads to higher and harder-to-get homeowner’s insurance. The city carries the third-highest premium-to-market ratio in the nation at 2.2%, meaning a $350,000 home could cost $7,700 annually in insurance alone.
2. North Port-Sarasota-Bradenton, Florida: Pandemic Gains Almost Fully Erased

Four of the five U.S. metro areas that experienced the biggest drop in home prices between January 2025 and January 2026 were in Southwest Florida. Punta Gorda fell nearly 12%, Cape Coral-Fort Myers dropped over 9%, and North Port-Sarasota-Bradenton saw prices sink roughly 7.5%. These are not rounding errors. For buyers who purchased near the 2022 peak, that translates to tens of thousands of dollars in lost equity.
Punta Gorda, which is part of this broader metro zone, saw home prices spike over 70% between March 2020 and August 2022, a run-up that virtually guaranteed a painful period of mean reversion. Realtor.com projected prices would sink an estimated 8.9% in North Port-Sarasota-Bradenton during 2026. Rising insurance costs tied to hurricane risk, a slowdown in domestic migration into Florida, and a glut of standing inventory are all compounding the problem with no easy fix in sight.
3. Austin, Texas: The Boomtown That Overbuilt Itself Into a Corner

The median sold price inside the City of Austin as of April 2026 stands at $550,000, down $40,000 from $590,000 a year ago. That 6.8% year-over-year decline is the sharpest price drop in the local dataset and reflects what buyers and sellers inside the city limits are actually experiencing right now. For a city that was once the poster child of pandemic-era growth, that shift is striking.
The short answer is that Austin overbuilt. New construction flooded the market during the remote-work migration wave, and supply has been running ahead of demand ever since. Layer on top of that the surge in homeowner insurance costs, and the true monthly cost of owning a home in Austin has climbed even in neighborhoods where the list price has dropped. More than 65% of homes are closing below list price, and 69 of 75 tracked ZIP codes are below their 12-month price peak.
4. Denver, Colorado: A Quiet Correction Gaining Speed

Home prices in Denver are expected to stumble in 2026, falling by around 3.4%, and prices were already dipping with many sellers pulling their listings off the market. Denver benefited enormously from the remote-work migration wave that sent buyers west and south, but that tailwind has reversed. The city now faces a combination of rising inventory and buyers who simply won’t stretch to meet pandemic-era price expectations.
An increase in multifamily housing within the Denver metro area has added downward pressure, as these properties typically carry lower price points and can pull down the median home price. For many low-income households in Denver, renting is currently more affordable than buying, which reduces demand for entry-level homes and contributes to declining median prices. The correction has been gradual, but certain Sun Belt and Mountain West markets that saw rapid pandemic-era construction booms are experiencing softer price growth as higher inventory levels and moderating in-migration put sustained downward pressure on prices.
5. New Orleans, Louisiana: Structural Weakness Beneath the Cultural Appeal
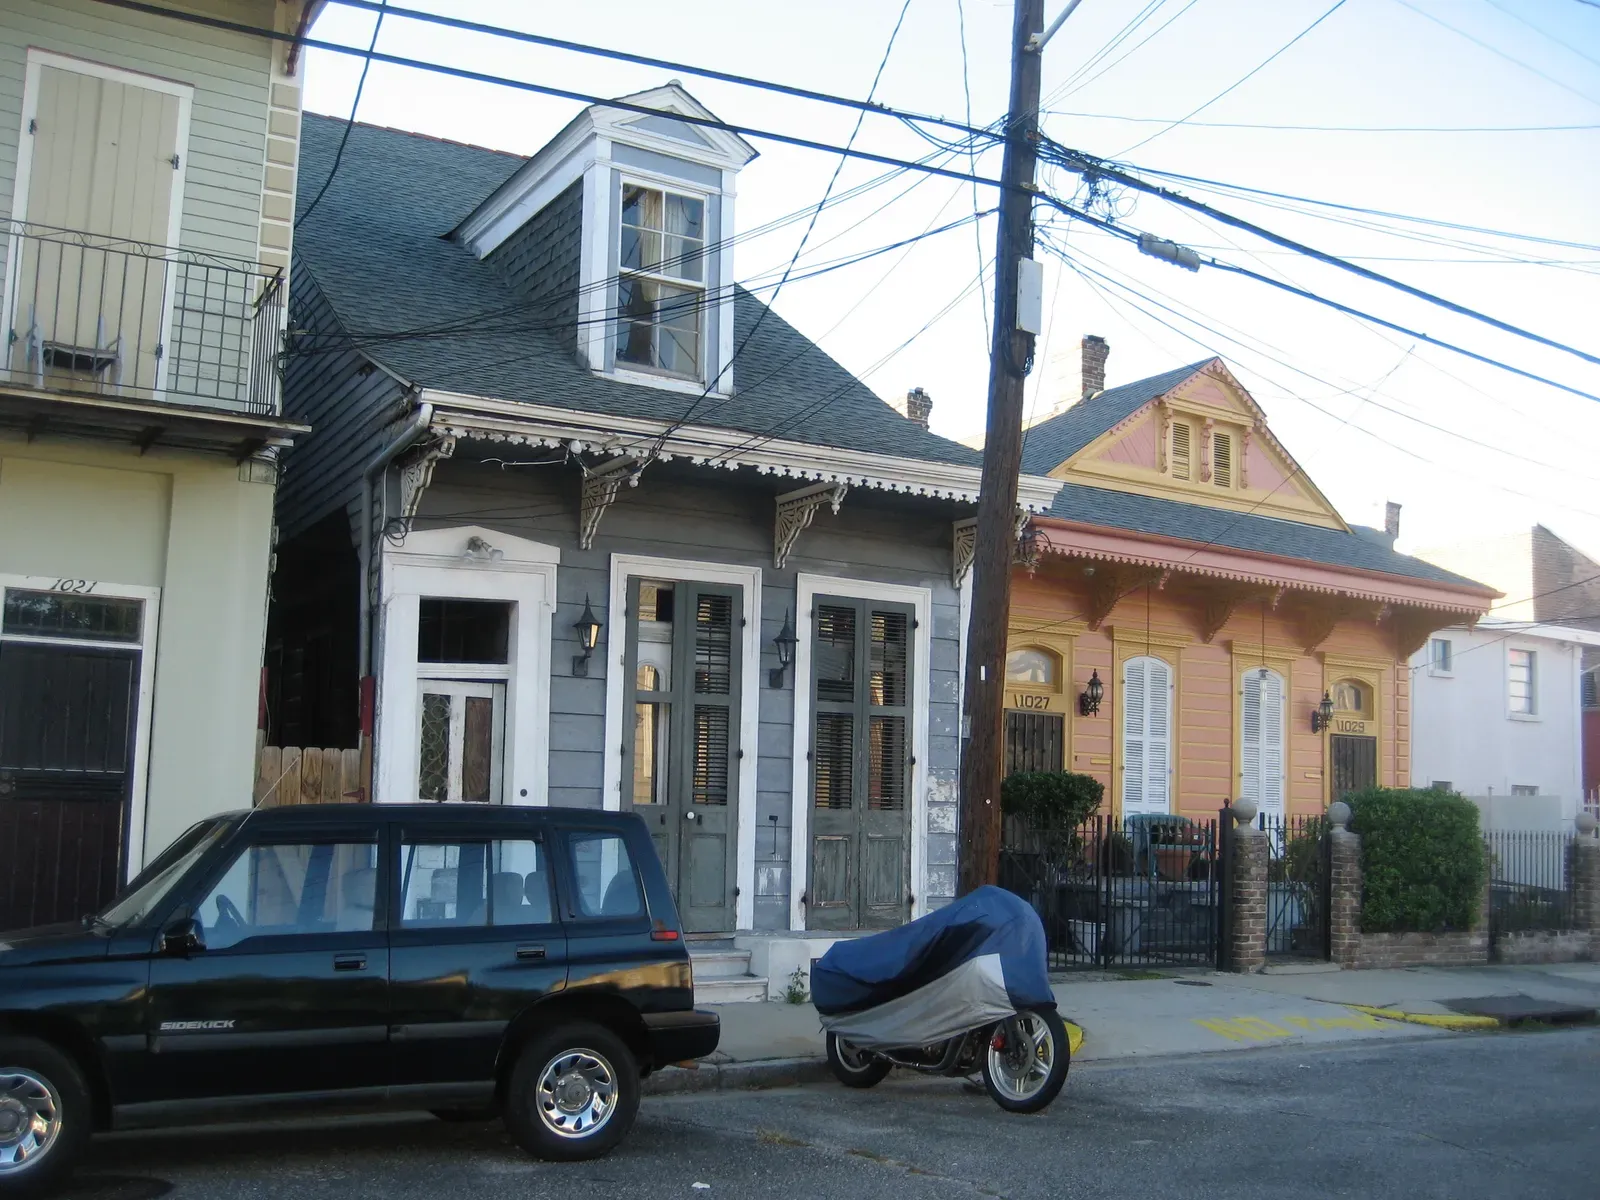
In 27 of the 33 big and expensive cities tracked through March 2026, mid-tier home prices were down from their respective peaks in prior years, with New Orleans showing a decline of roughly 19%. That’s one of the steepest peak-to-present drops in the country, a number that rarely gets the attention it deserves given the city’s cultural profile.
A one-year forecast going out to September 2026 shows a potential further decline of around 4% for the New Orleans market. This could be influenced by a number of factors, including national economic conditions, changes in mortgage rates, and local job growth. The city’s dependence on tourism and the hospitality sector makes its housing demand unusually sensitive to broader economic shifts, and its chronic insurance and flood-risk challenges add a long-term cost burden that buyers elsewhere don’t face to the same degree.
6. Tampa-St. Petersburg, Florida: Population Reversing, Listings Piling Up

The top metros where home values decreased the most in 2025 were dominated by Florida, with North Port-Bradenton-Sarasota leading, followed by Cape Coral-Fort Myers, then Austin, and then Lakeland-Winter Haven and Tampa-St. Petersburg-Clearwater further down the list. Tampa’s situation is particularly notable because the city had positioned itself as one of Florida’s safest bets, with a diversified economy and a growing tech presence. That narrative has grown harder to sustain.
Pinellas County, home to St. Petersburg, posted one of the largest numeric population declines of any county in the country between July 2024 and July 2025. A big part of the broader Florida price dip stems from plummeting condo prices, largely a result of new safety legislation passed after the Surfside tragedy, which mandated more funding for building maintenance and inspections. This led to significant increases in homeowner association special assessment fees, making condo ownership dramatically more expensive.
7. Spokane, Washington: A Smaller Market With Outsized Vulnerability

Home prices in the Spokane-Spokane Valley area are expected to fall by around 3.5% in 2026. One local news report characterized the current market as “slow and expensive,” suggesting a price dip could help get sales moving again. Spokane benefited strongly from pandemic-era migration out of pricier Pacific Northwest cities like Seattle and Portland, but much of that buyer pool has either arrived or pulled back, leaving the market exposed.
Smaller markets can be more susceptible to volatility if major employers shrink or leave, or if inventory jumps significantly without enough incoming demand. A recent price dip suggests supply might be starting to outweigh demand, or buyers are simply saying no at current price levels after the earlier growth surge. The current trigger is high cost of financing and affordability exhaustion rather than a spike in defaults, meaning the slide may be slower and less dramatic, but still very real, and in many ways more insidious because it is happening region by region rather than as a global crash.
What’s Actually Driving These Declines?
The typical monthly mortgage payment on a median-priced home now consumes roughly 35 to 40% of the median household income, depending on the rate environment. That’s well above the 25 to 30% range that economists consider sustainable, and the NAR’s Housing Affordability Index has been at its lowest sustained level in decades. When affordability gets stretched that far, demand doesn’t just slow. It retreats, and it tends to retreat first in the markets that ran up the fastest.
According to Federal Reserve data, the median sales price of a U.S. home reached $410,800 in the second quarter of 2025, a 42% jump over the past decade. A typical household now needs to earn roughly $118,530 a year to afford a median-priced home, yet the actual median household income as of 2024 was just $83,730. That gap is not a minor imbalance. It’s the fundamental math that keeps demand weak in these overextended markets, regardless of what happens to mortgage rates in the short term.