
The assumption that certain zip codes are simply safe is one of the more persistent fictions in American life. People move to suburbs, settle into quieter towns, and breathe a little easier – believing that distance from a city core is the same as distance from crime. The picture is more complicated than that, and recent data makes it harder to ignore.
Crime patterns across the United States have been shifting in ways that confound old mental maps. National totals may look encouraging on the surface, but beneath the headline numbers lies a more uneven story – one where the geography of risk is quietly reshuffling, and communities that once felt insulated are now paying closer attention to their own streets.
The Headline Numbers vs. What’s Actually Happening

The FBI released crime data confirming that the overall rates of violent and property crime in the United States declined in 2024, recording the lowest property crime rate and lowest violent crime rate since at least 1969. That is genuinely significant progress. Nationally, the rate of violent offenses reported to police declined nearly six percent from 2023 to 2024.
Still, aggregate numbers can obscure a lot. Reported crime statistics are built almost entirely on crimes that victims actually report to police – and for property crime, the most common form of criminal victimization in America, most victims never make that call. That gap between what happened and what was officially recorded matters enormously when trying to understand whether any given neighborhood is genuinely getting safer.
Urban vs. Suburban: A Widening Divide
In 2019, the rate of violent crime in urban areas was roughly identical to the rate nationwide. By 2024, the urban rate of violent crime increased by 61% and was more than double the rural rate. That is a striking divergence over just five years. The suburban violent crime rate, by comparison, remained close to what it was in 2019, sitting at 23.3 per 1,000 persons in both 2023 and 2024.
Property crime tells a different part of the story. In 2019 the property crime rate was 51% higher in urban areas than it was nationwide; in 2024 it was 86% higher. The number of property crime victimizations in 2024 per 1,000 households was 181.6 in urban areas, 96.1 in suburban areas, and 48.3 in rural areas. Suburbs sit squarely in the middle – not immune, and no longer able to rely simply on proximity to green spaces as a safety buffer.
The Urban-Nonurban Divide Is Weakening
Recent analyses using the National Crime Victimization Survey suggest the urban-nonurban divide has weakened, with suburban and rural areas experiencing increases in robbery, aggravated assault, and nonfatal gun victimization. This is one of the more underreported findings in recent crime research. The perception of suburbs as a natural refuge from urban disorder is increasingly at odds with what victim surveys are picking up.
Crime is rising in suburban and rural America, a situation particularly troubling for those who moved to these communities post-pandemic. This shift is further accentuated in the rates of aggravated assault, which have not only risen in urban areas but have skyrocketed in non-urban areas. Gun-related victimization rates doubled over several years in the suburbs and surged in rural areas, returning to rates last observed in 1997.
When Violence Shifts Rather Than Disappears
Even when homicides fall in large cities, violence can shift rather than disappear. Suburban and rural areas are seeing increases in certain violent categories, and if prevention and enforcement capacity remain concentrated in cities, non-urban areas may be less prepared for spikes in violence. This is the displacement problem that criminologists have long flagged – enforcement pressure in one place doesn’t eliminate criminal activity, it often just redirects it.
Jurisdictions that used federal prevention funds for crime suppression are likely to see the quickest upticks in crime, while those that invested in broader prevention may experience a slowing of recent crime declines. As those federal dollars wind down through 2026, some communities that had grown accustomed to the cushion of grant-funded programs are already beginning to feel the effects of their absence.
The Underreporting Problem in “Quiet” Communities

One of the main reasons suburban and rural crime looks lower on paper is that it’s reported at different rates than urban crime. About 38% of violent victimizations in urban areas were reported to police, which was lower than the percentages in suburban areas at 43% and rural areas at 51%. Higher reporting rates in quieter communities actually mean their crime numbers are more complete – meaning the true gap between urban and non-urban crime may be smaller than raw data suggests.
The latest National Crime Victimization Survey noted that less than half of all violent victimizations were reported to law enforcement; the rest don’t appear in police or FBI statistics. For suburban residents who assume their neighborhood’s clean record reflects genuine safety, this is worth sitting with. A quiet police blotter is not always the same thing as a safe street.
Property Crime and the Shifting Geography of Theft

There were fewer residential burglaries and larcenies in 2024 than in 2019 in major cities, but motor vehicle thefts were higher by more than half compared to five years earlier. Motor vehicle theft, in particular, tells its own geographic story. Stolen vehicles are often used to commit other crimes, including robberies, burglaries, and drive-by shootings – meaning the ripple effects of vehicle crime extend well beyond the theft itself.
Elevated property crime rates are concentrated in the West and Southwest, with certain states recording especially high figures, while factors such as urban density, economic pressures, and policing strategies contribute to these variations. Communities on the suburban fringes of rapidly growing metro areas, where policing resources haven’t kept pace with population growth, are particularly exposed to this dynamic.
Does Neighborhood Watch Still Work?
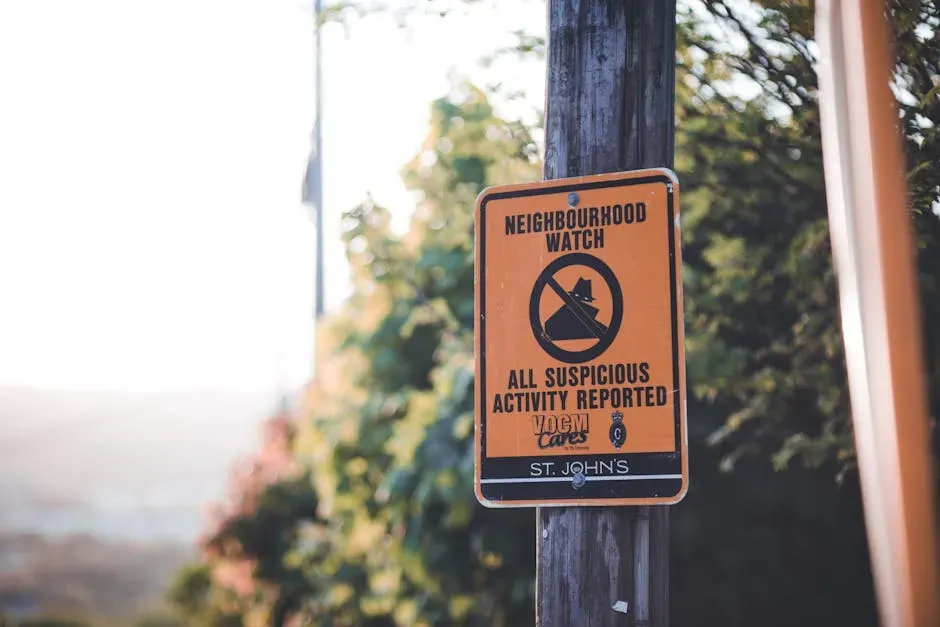
The name of the program is almost nostalgic at this point – block captains, yard signs, phone trees. Neighborhood watch programs are community-based initiatives designed to enhance local safety and reduce crime through citizen involvement, originating in the late 1960s as a grassroots response to rising burglary rates, and they encourage collaboration among neighbors who act as the “eyes and ears” for police. The underlying logic hasn’t changed much, even if the tools have.
Research shows that neighborhood watch was associated with a reduction in crime of between 16 and 26 percent. That’s a meaningful range, and not a trivial result. While these initiatives have been linked to improved community ties and a reduction in fear associated with crime, their effectiveness remains a topic of debate – some studies suggest their success may be limited to more affluent areas, raising questions about applicability in diverse socioeconomic contexts.
The Technology Shift in Community Surveillance
Modern neighborhood watch looks very different from the 1980s model. Digital platforms, doorbell cameras, and community alert apps have transformed how residents share information about suspicious activity. Participants often create communication networks, including telephone trees and online platforms, to quickly disseminate information within the neighborhood. The speed of that information flow has changed dramatically with smartphones.
The most frequently suggested mechanism by which neighborhood watch reduces crime is residents looking out for and reporting suspicious activities to the police, but watch programs might also reduce crime by reducing opportunities for crime through various mechanisms of social control and by enhancing police detection through increased flow of useful information from the public. When that information flows faster and covers more ground, the deterrent effect compounds. Some jurisdictions have seen measurable results – license plate readers in Washington helped recover thousands of stolen vehicles, contributing to meaningful improvements in crime rates.
Where Federal Funding Cuts Leave Communities Exposed

The Justice Department cut grants to hundreds of organizations focused on community safety, including school violence prevention programs, community violence intervention, and training for rural police officers – and many of the affected organizations have already had to shrink their services or lay off employees. For suburban and rural communities with fewer institutional resources to begin with, this is not a minor bookkeeping issue.
The gravitational pull of lower crime from massive federal spending will wane substantially through 2026. States and local governments used these funds in different ways and have varying access to sustainable resources to replace federal dollars. Communities that built their public safety architecture around federal grants – rather than local capacity – are now discovering how thin that foundation actually was.
What 2026 Actually Looks Like on the Ground

Reported levels of 11 of the 13 offenses tracked in major cities were lower in 2025 than in 2024, and nine of those offenses declined by 10% or more. Drug crimes were the only offense category that increased. The trend lines for large cities are genuinely encouraging. The rate of reported homicides was 21% lower in 2025 than in 2024, there were 9% fewer reported aggravated assaults, 22% fewer gun assaults, and robbery fell by 23% while carjackings decreased by 43%.
The risk, heading into the rest of 2026, is that these citywide improvements don’t automatically translate to the communities that surround them. Forecasters expect greater variation in crime in 2026 than in 2025, and that variation is unlikely to be evenly distributed. The key test is whether progress extends to the highest-risk neighborhoods and emerging non-urban hot spots – communities that are still working out, often without adequate resources, what it means to keep watch over their own streets.